Bio Link
Bio Link analytics
Views per block, click rates, pixel integrations.
Every Bio Link page tracks visits + per-block clicks. Pro tier adds per-source breakdown; Business tier adds external pixel integrations.
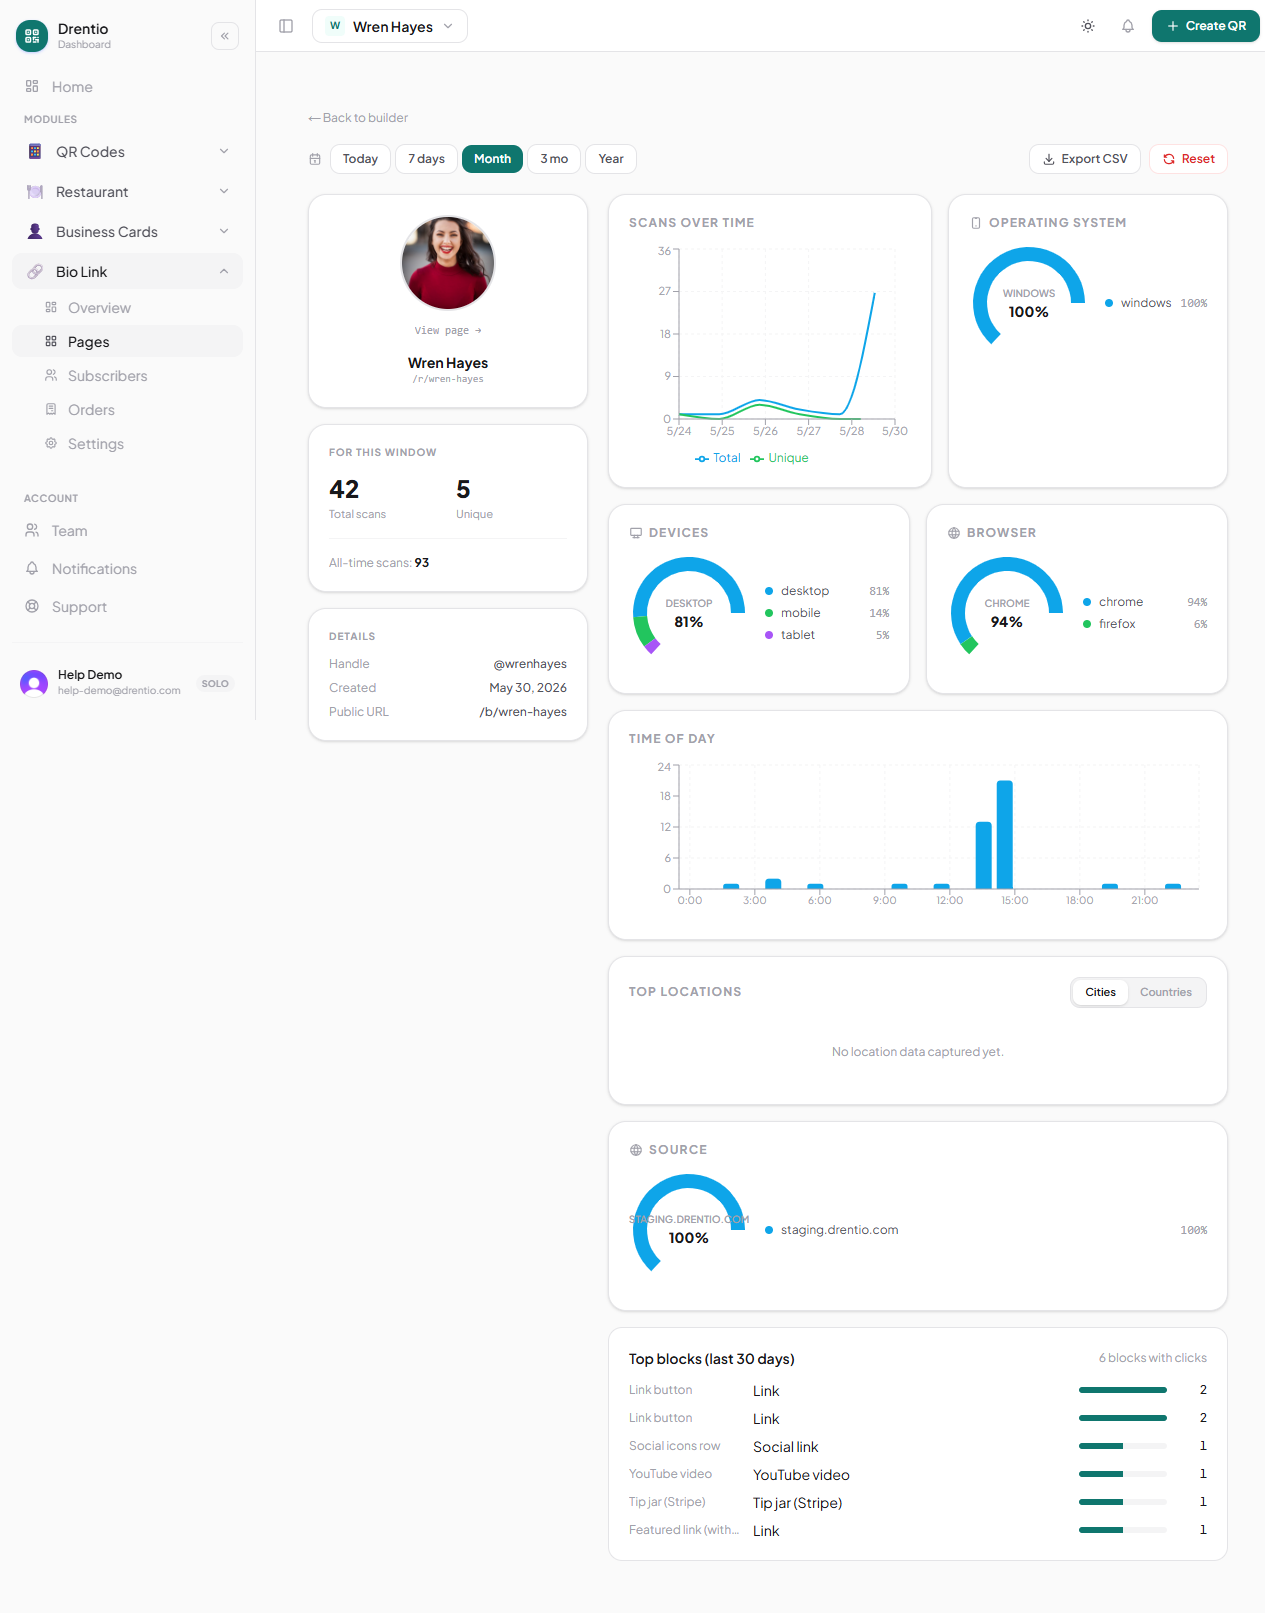
What you see
| Metric | What it tells you |
|---|---|
| Visits | Anyone landing on the page |
| Block clicks | Tap-throughs per block |
| Click rate | Block clicks / visits |
| Top block | Highest-converting block on the page |
| Source | Instagram / TikTok / direct / QR (Pro+) |
| Device | iOS / Android / desktop |
| Geo | Country + city (rough) |
How to read it
Step 1 — Open the page's Analytics tab
Bio Link → smash-co-brooklyn → Analytics.
Step 2 — Look at click rate per block
Sort blocks by click rate. Move high-performers up; cull low-performers.
Step 3 — Check the source mix
If 80% of your traffic is from Instagram, your page should be optimized for IG users (mobile-first, short copy, visual-led). If 80% is from QR scans (in-person), lean into product/menu shortcuts.
Pixel integrations (Business tier)
Drop external tracking pixels:
- Meta Pixel (Facebook / Instagram ads) — track conversions
- Google Analytics 4 — funnel reporting
- TikTok Pixel — TikTok ads conversions
Configure: Bio Link → Settings → Integrations. Paste your pixel ID. We inject the tracker on every page load.
The 80/20 of bio-page analytics. Don't obsess over total visits — obsess over click rate on your primary block. If your top link is a 30% click rate, you've nailed it. Under 10% means visitors hit the page and bounce; rework the header copy or move the primary action higher.
Plan note
- Visits + per-block clicks: Free
- Source + device + geo + 90-day retention: Pro ($9/mo)
- Pixel integrations + unlimited retention: Business ($29/mo)