QR codes
Scan analytics
Device, country, per-code view counts.
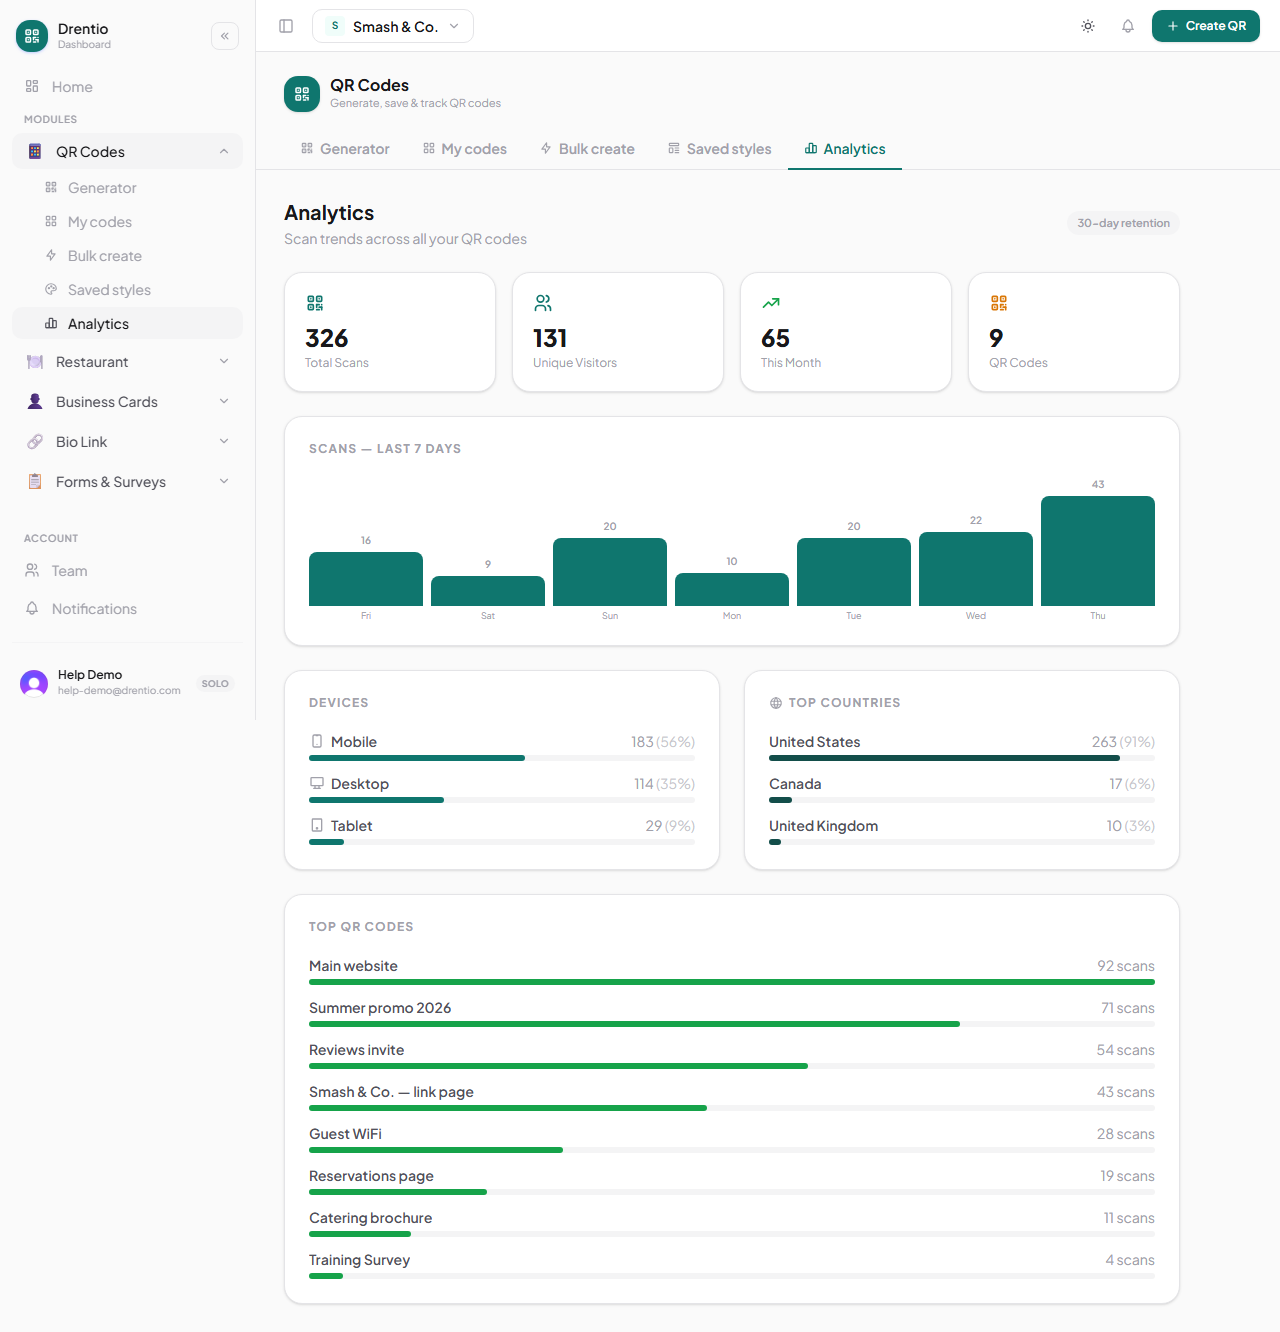
Every dynamic QR records each scan: timestamp, device type, country, city (when available). Aggregated in your analytics dashboard so you can see what's working.
What gets tracked
Per-scan:
- Date + time
- Device — iOS / Android / Desktop
- Browser
- Country (from IP, ~95% accurate)
- City (when the IP geolocation is confident)
- Referrer (rare — usually direct)
Per-code (rolled up):
- Total scans (lifetime)
- Last scan timestamp
- Scans by day chart (30 / 90 / 365 days depending on plan)
- Top countries
- Device split
Where to find it
Step 1 — Open QR Analytics
From /dashboard/<brand>/qr/analytics. The page shows your account-wide overview.
Step 2 — Drill into a specific code
Tap any code in the list. The code-detail page shows its own time-series, geo breakdown, device breakdown.
What's NOT tracked (intentional)
- ❌ The scanner's identity — we don't fingerprint or track individuals
- ❌ Repeat scans by the same device aren't deduplicated as "unique users" (we can't reliably know)
- ❌ Scans on static codes — by design, static QRs go direct to the destination without passing through us
If you need unique visitors / cohorts, route to a landing page with GA4 or Plausible installed.
Retention
- Pro — 30 days of detailed history; aggregate totals forever
- Business — 365 days of detailed history
Older detailed records are deleted; aggregate counters (total scans, lifetime by country) stay forever.
Use analytics to A/B your placement. Two static codes for the same content, one at the entrance, one at the table. After two weeks, compare scan counts. You just earned actionable data on where customers actually engage.